I’ve been working on a tool that will let me visualize the PDCCH resources in NR, and I will show and discuss some of its features in this post.
I’ve always thought that one way to understand something is to program a computer to do it. In the job of doing that, I typically find out gaps in my knowledge or even more so, areas for which I had only a superficial understanding for - ““The best way to understand something is to teach it to a computer” [1].
Overview
The purpose of the tool is to show what PDCCH resources in the time-frequency grid will be monitored by a UE to decode PDCCH candidates.
The information is presented in a time-frequency grid in which each element in the grid is an REG in a single slot. PDCCH candidates are selected by the user and the REGs are colored showing which are used to carry CCEs.
The precise location of these elements depends on the chosen PDCCH configuration, the slot, UE and candidate(s) that have been selected.
There is support to visualize multiple UEs.
Windows
Here’s a screenshot of how the program looks when you open it up.
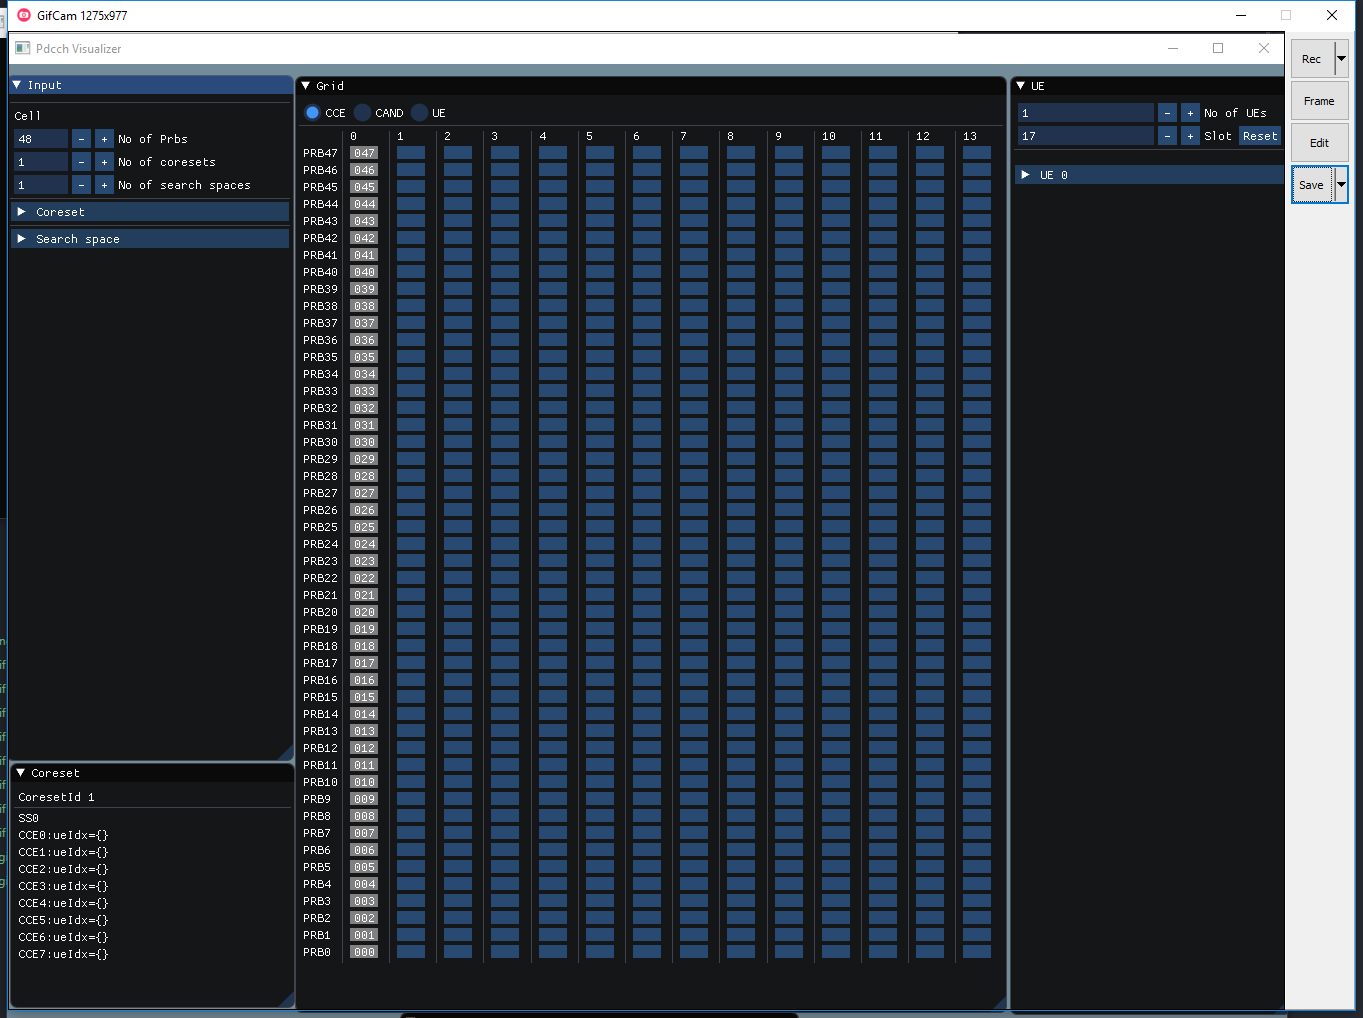
There are four “Windows”:
- To the left, the “Input” window is used to change the PDCCH configuration.
- To the right, the “UE” window is used to change what UEs to see and to add UEs.
- In the center, the “Grid” window is used to visualize PDCCH resources.
- In the bottom-left, the “Coreset” window is used to see what CCE indexes are being used.
In the “Grid” window, the gray area is the where the Coreset has its REGs. Each gray square represents an REG (the number is the REG number). PRBs start in the bottom and grow until the “No of PRBs” is reached.
PDCCH configuration
The window to the leftmost can be used to change the PDCCH configuration.
The fields in this window closely resemble those in the PDCCH configuration that is received in RRC message. If you know about PDCCH in NR, most of the fields will look familiar. Notice that you can add additional coresets and search spaces by increasing the “No of” fields.
See for example how changing the duration of the Coreset causes the gray area to expand.
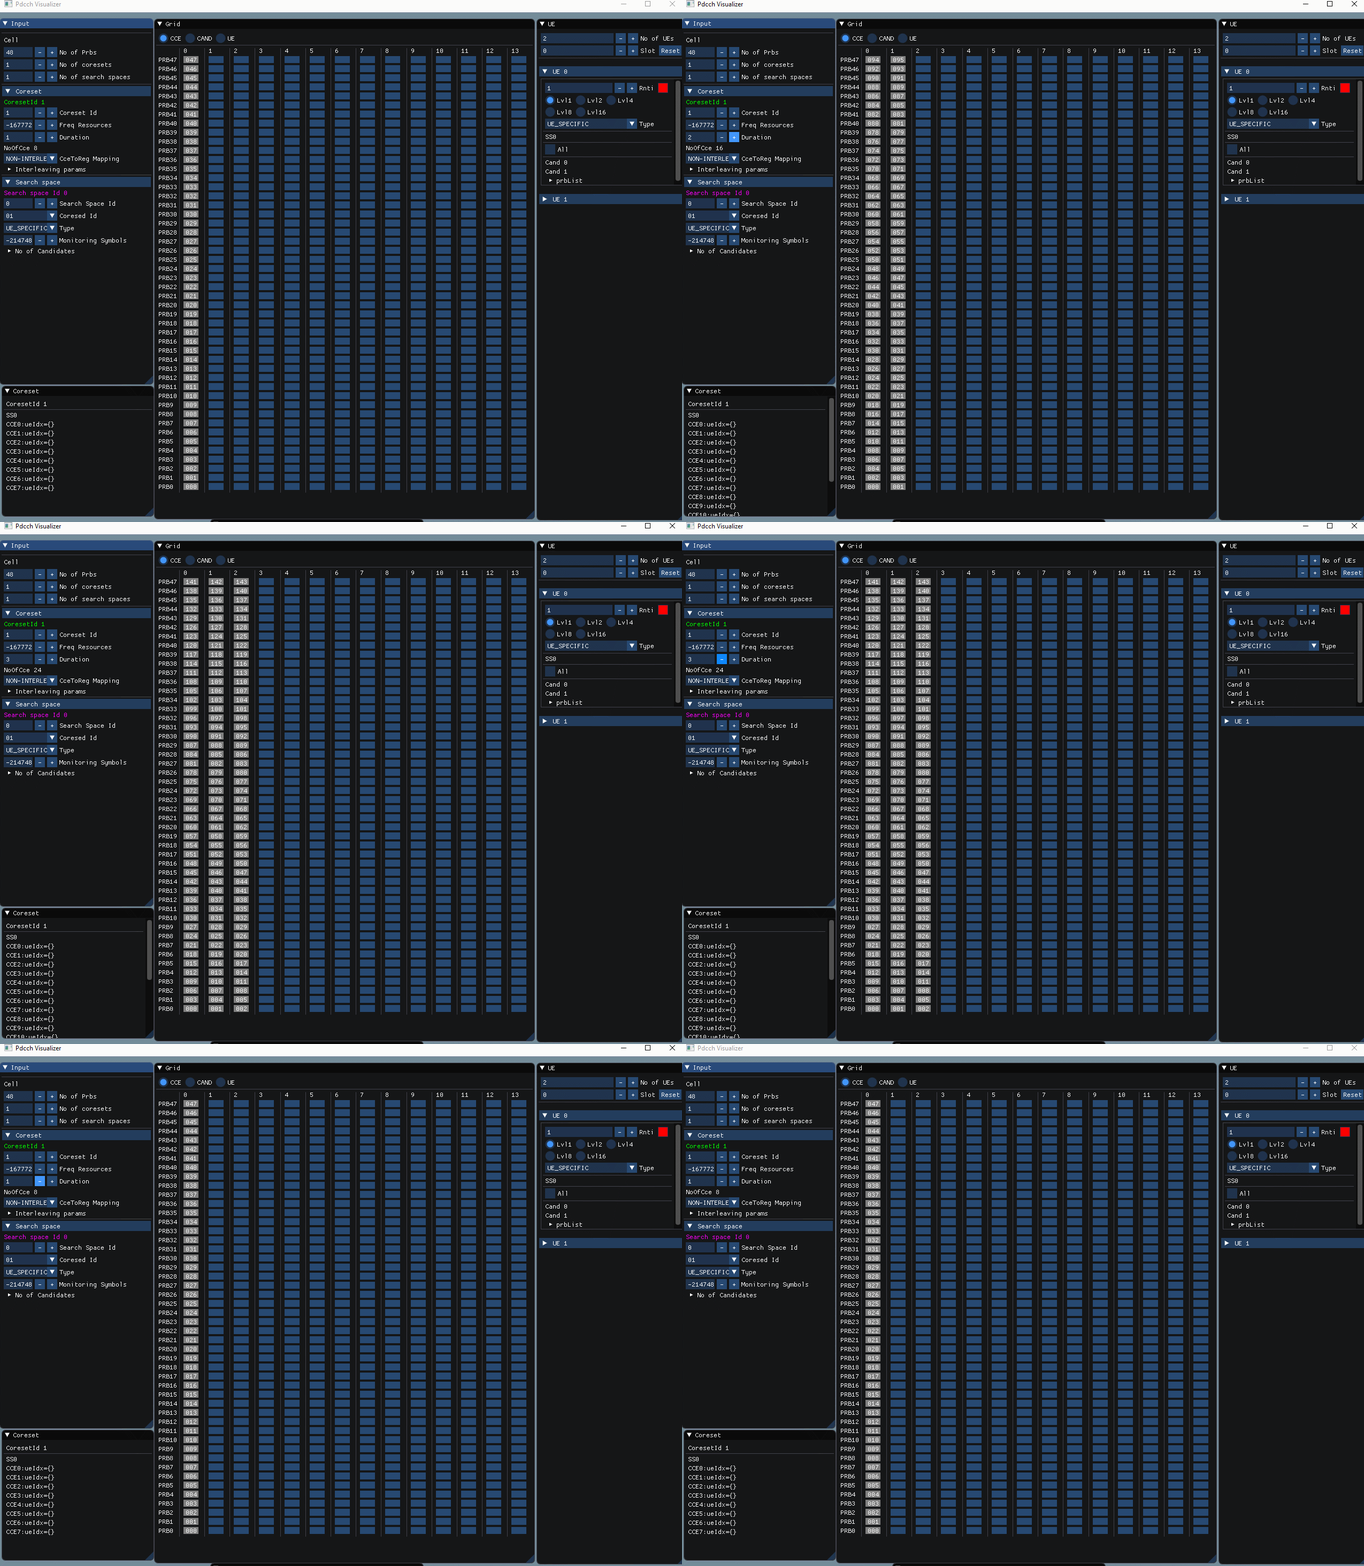
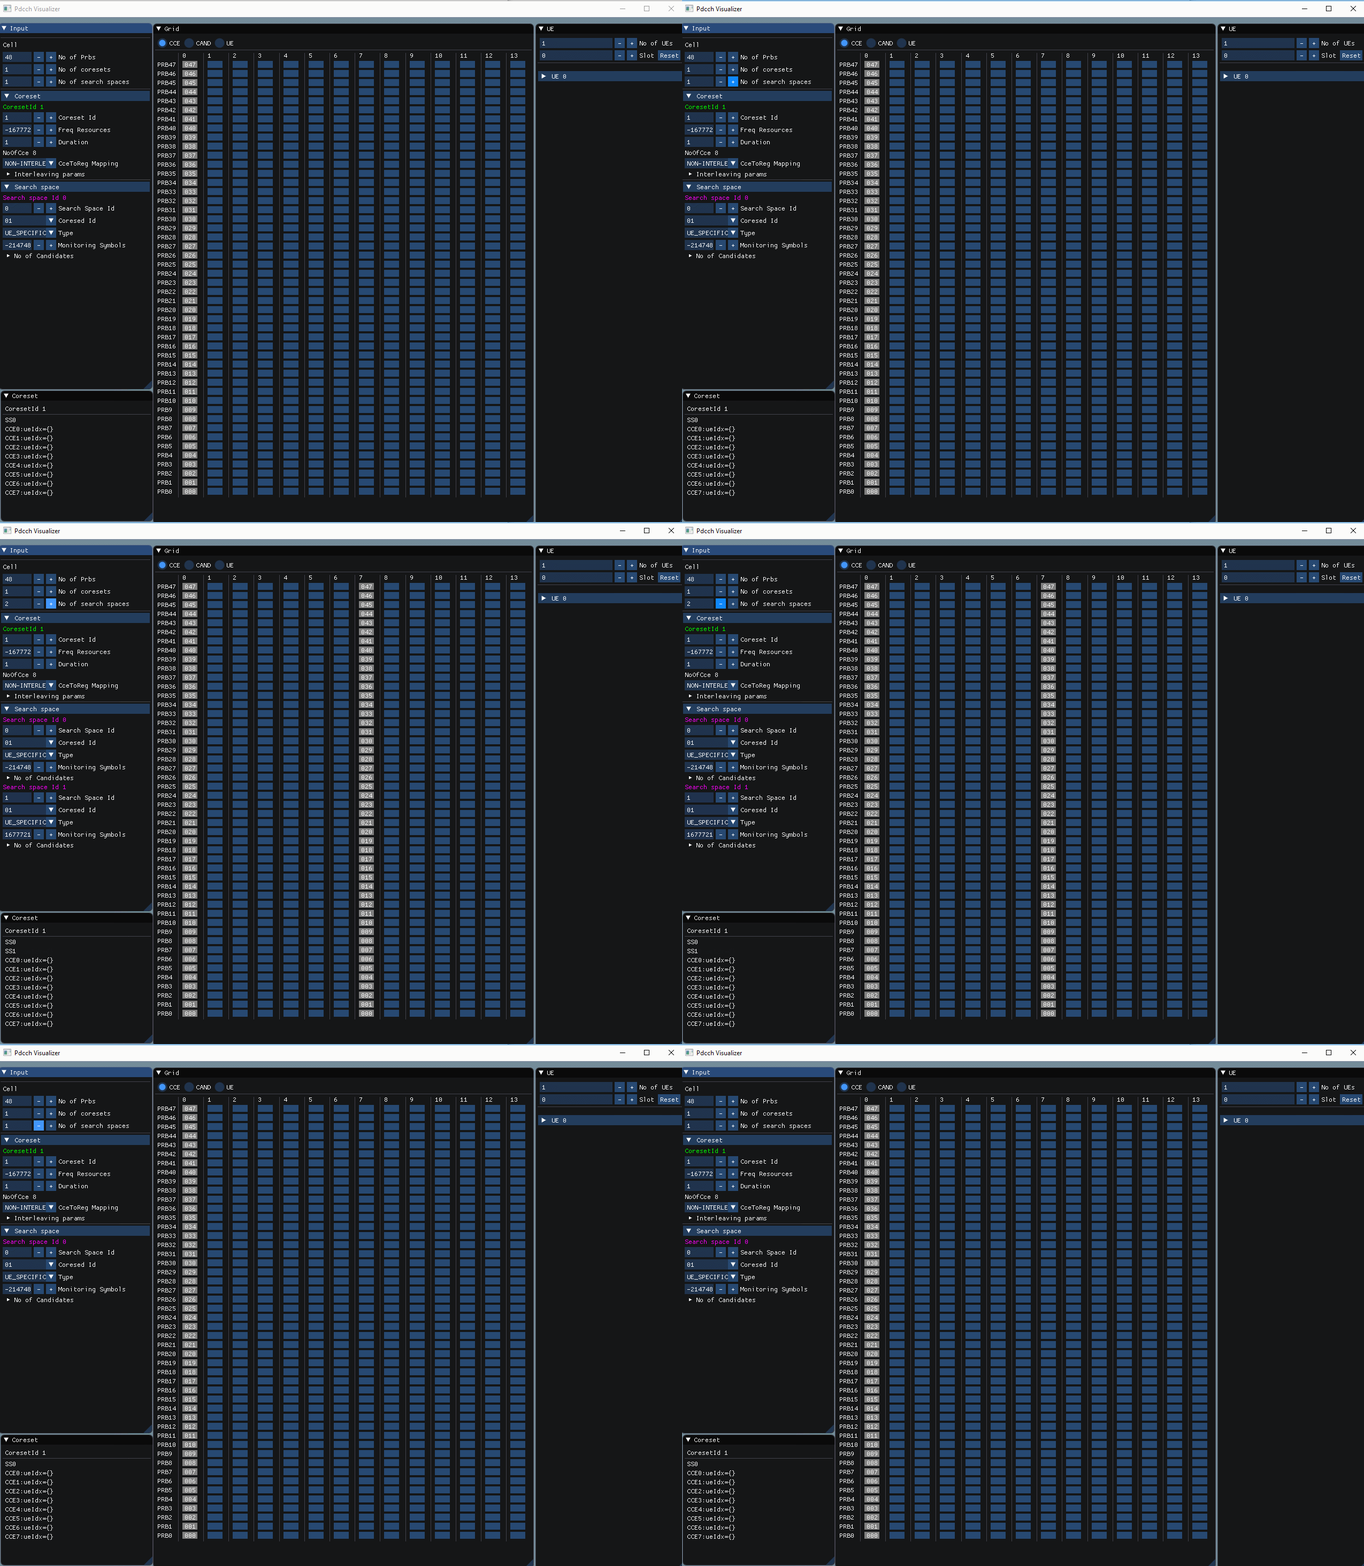
It is also possible to add more Search Spaces and Coresets.
In here, I add a new Search Space in the same Coreset (the new search space has different monitoring symbols).
PDCCH candidates
PDCCH candidates can be viewed by selecting “Cand x” from the UE window to the right.
See below how selecting “Cand 0”, shows where this PDCCH candidate is located in the time-frequency grid.
Notice that 6 REGs turn red. This represents one CCE, and the color red is the color of our UE in the UE window.
The number inside the red REGs is the CCE index.
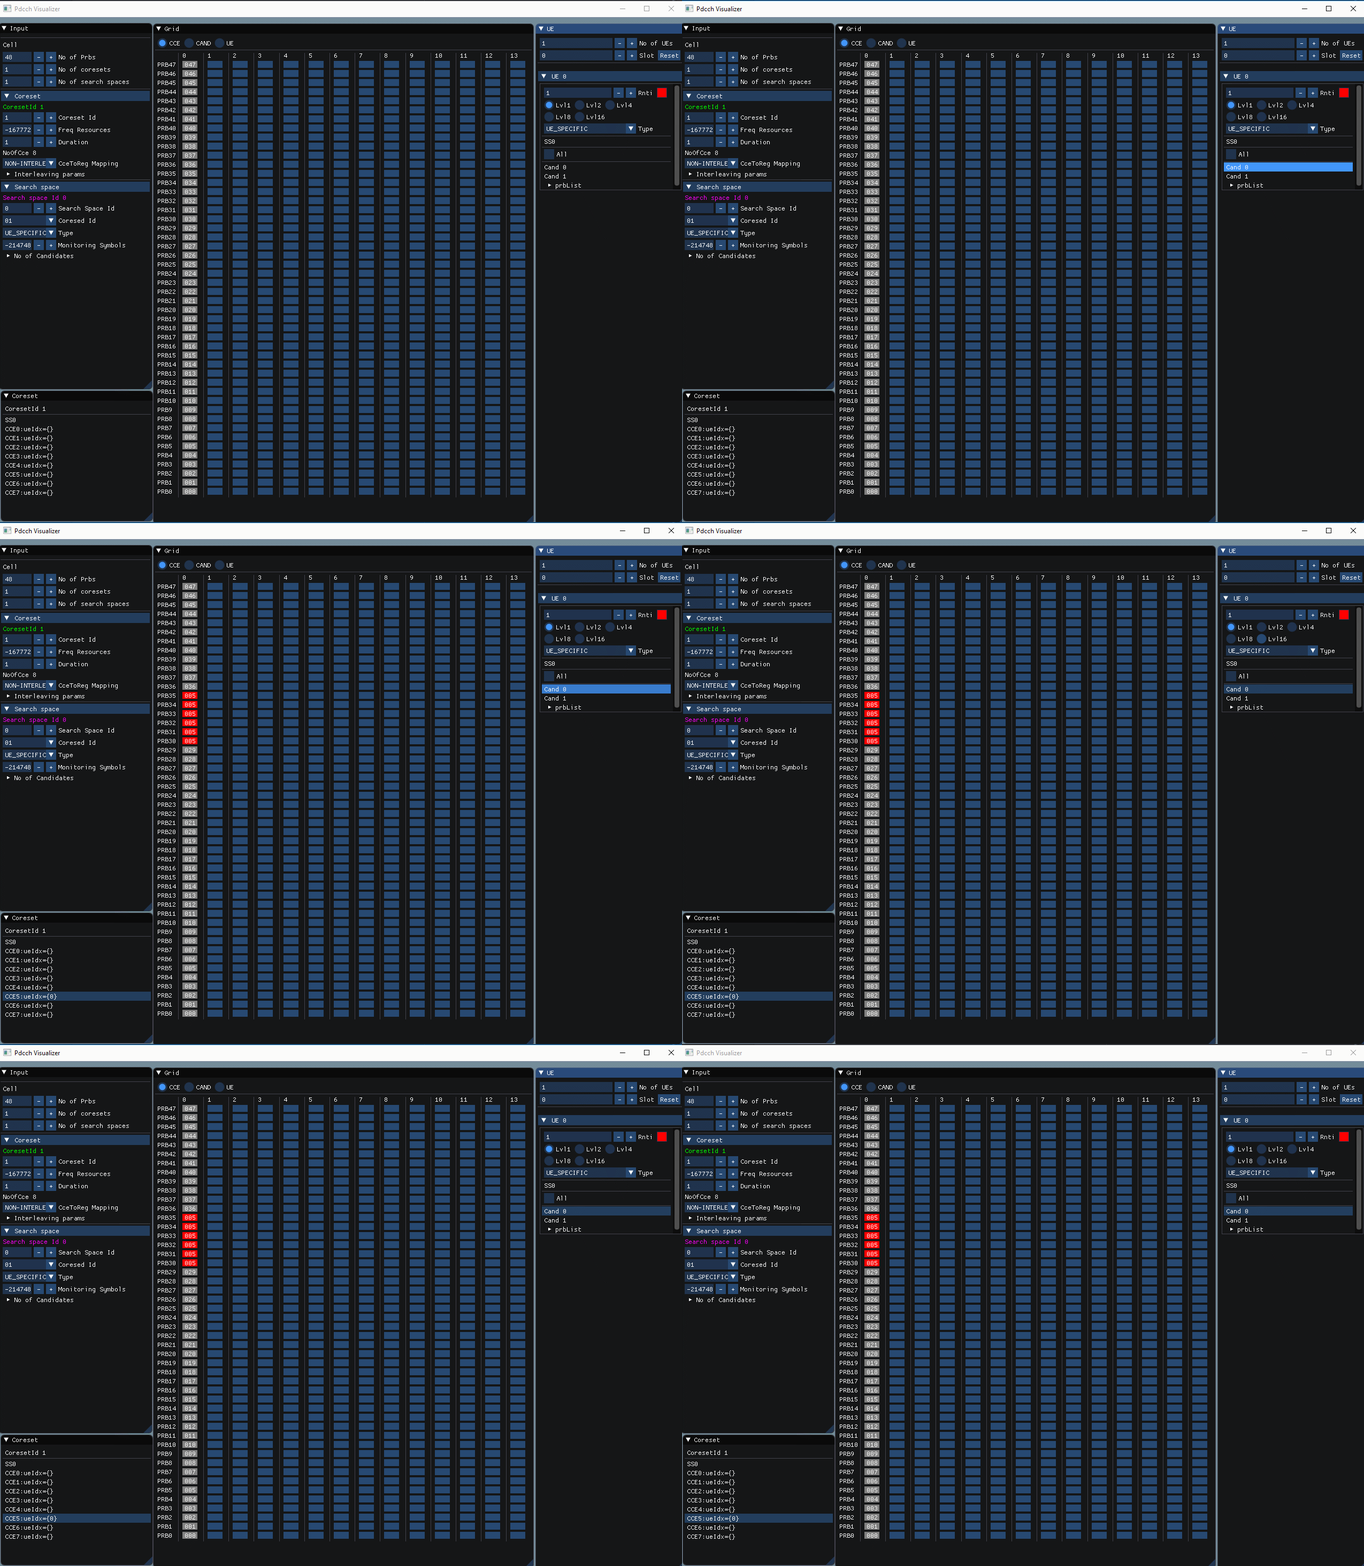
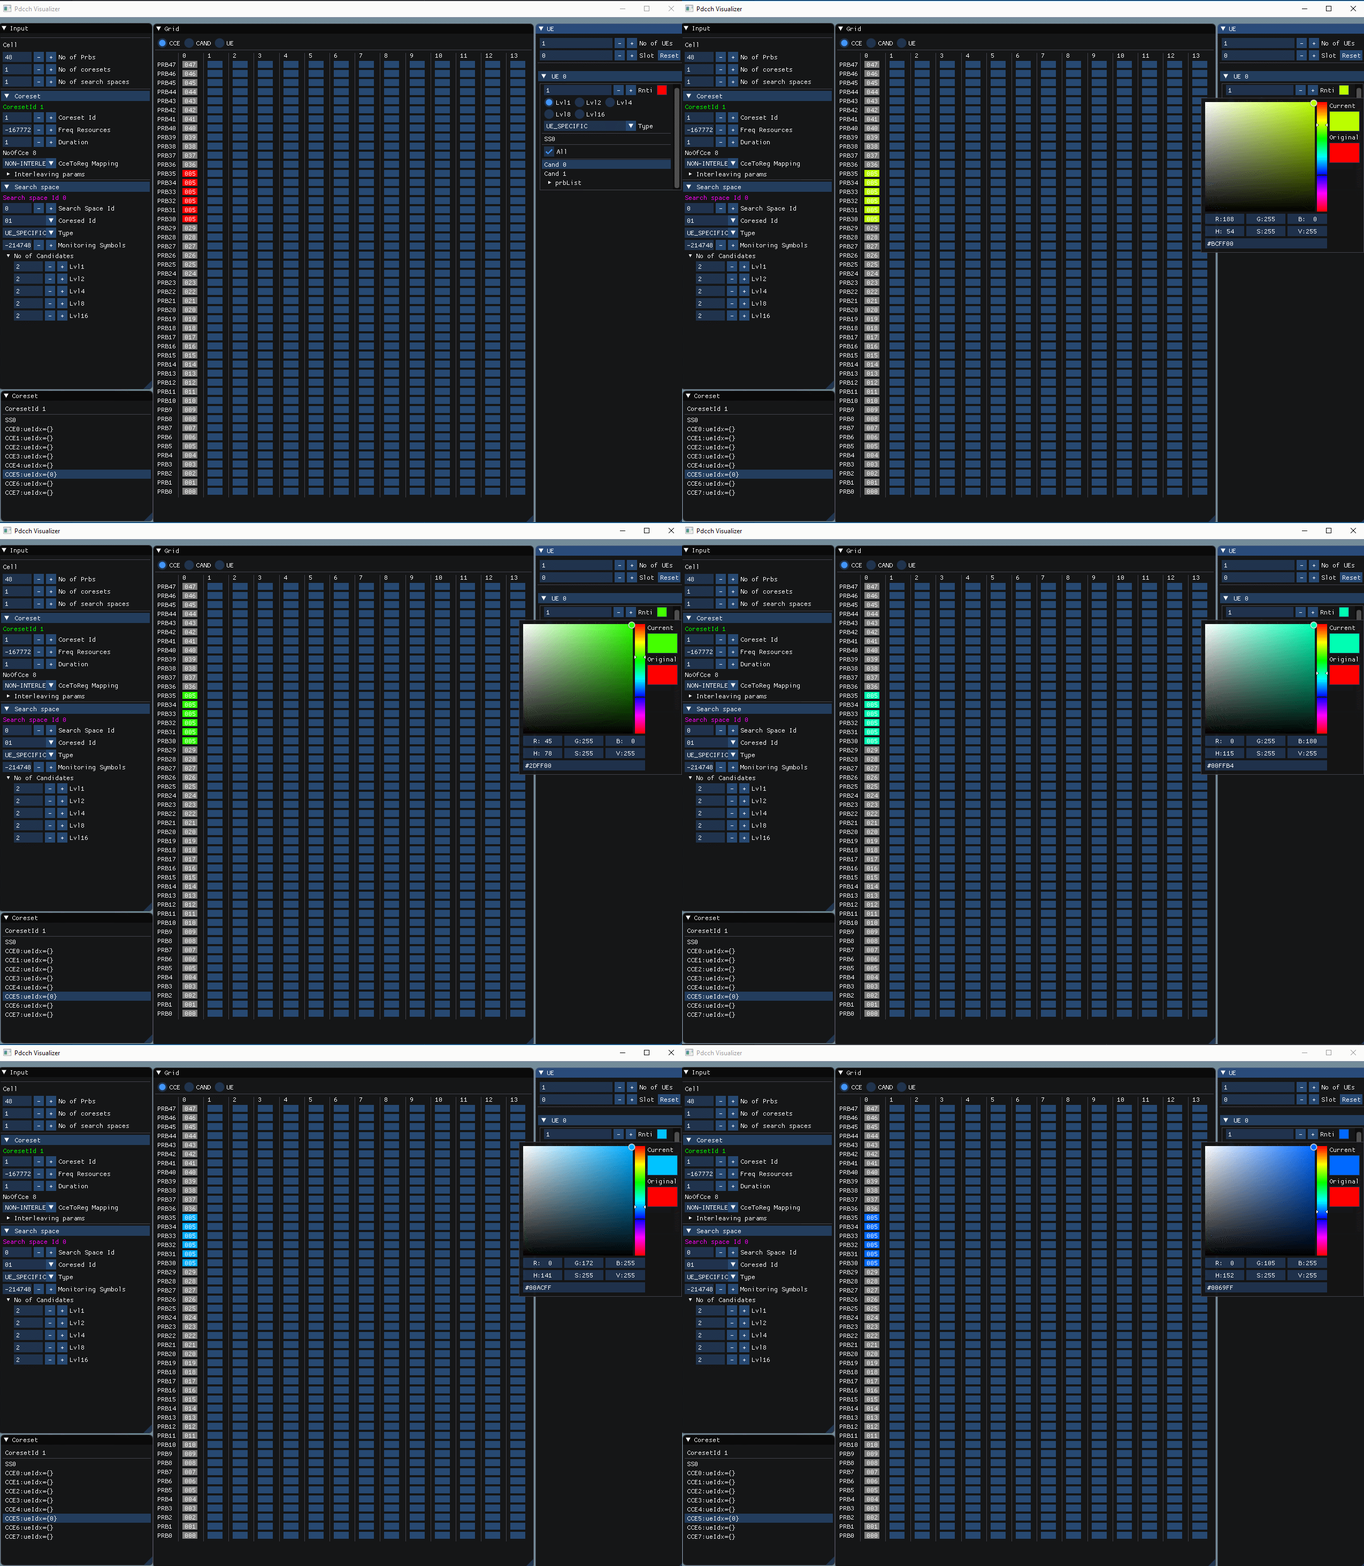
If you prefer another color, this is how you change it.
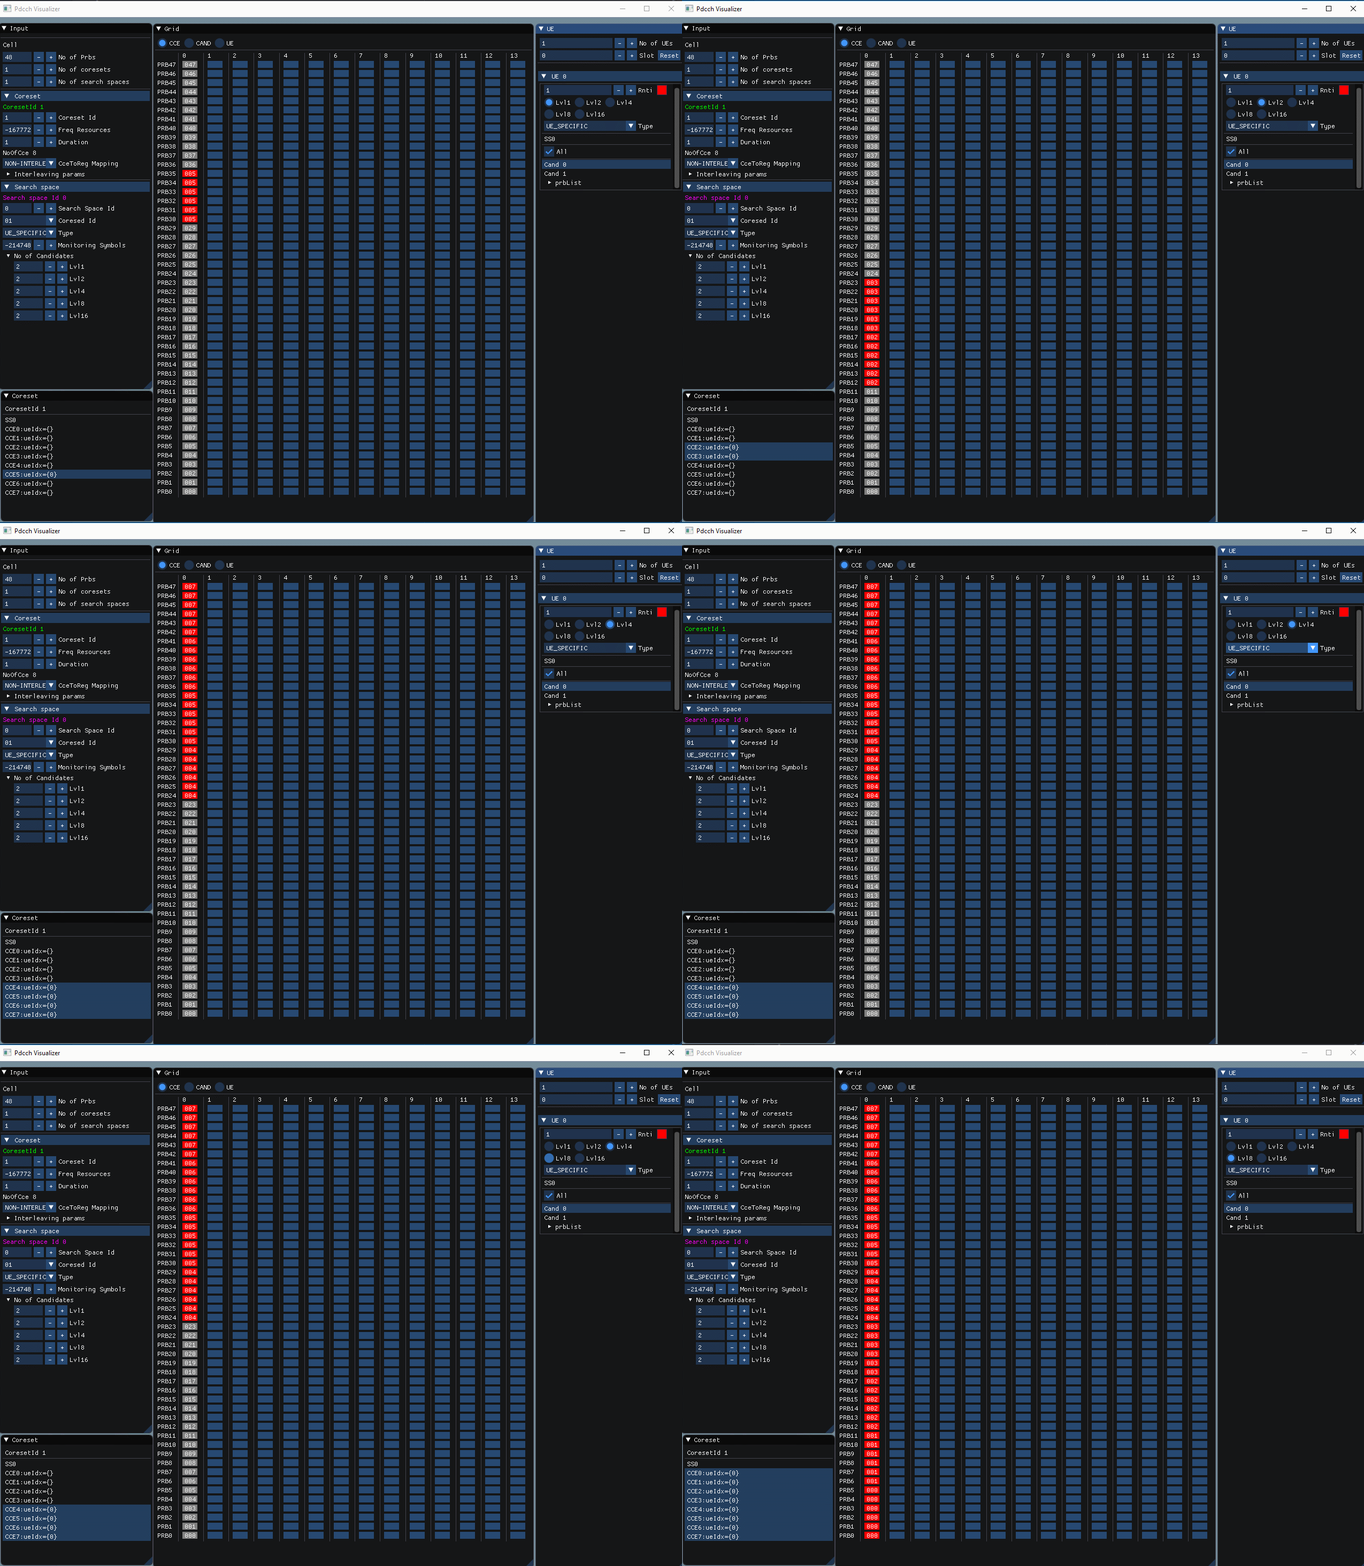
If you would like to see other aggregation levels, you can do this in the UE window.
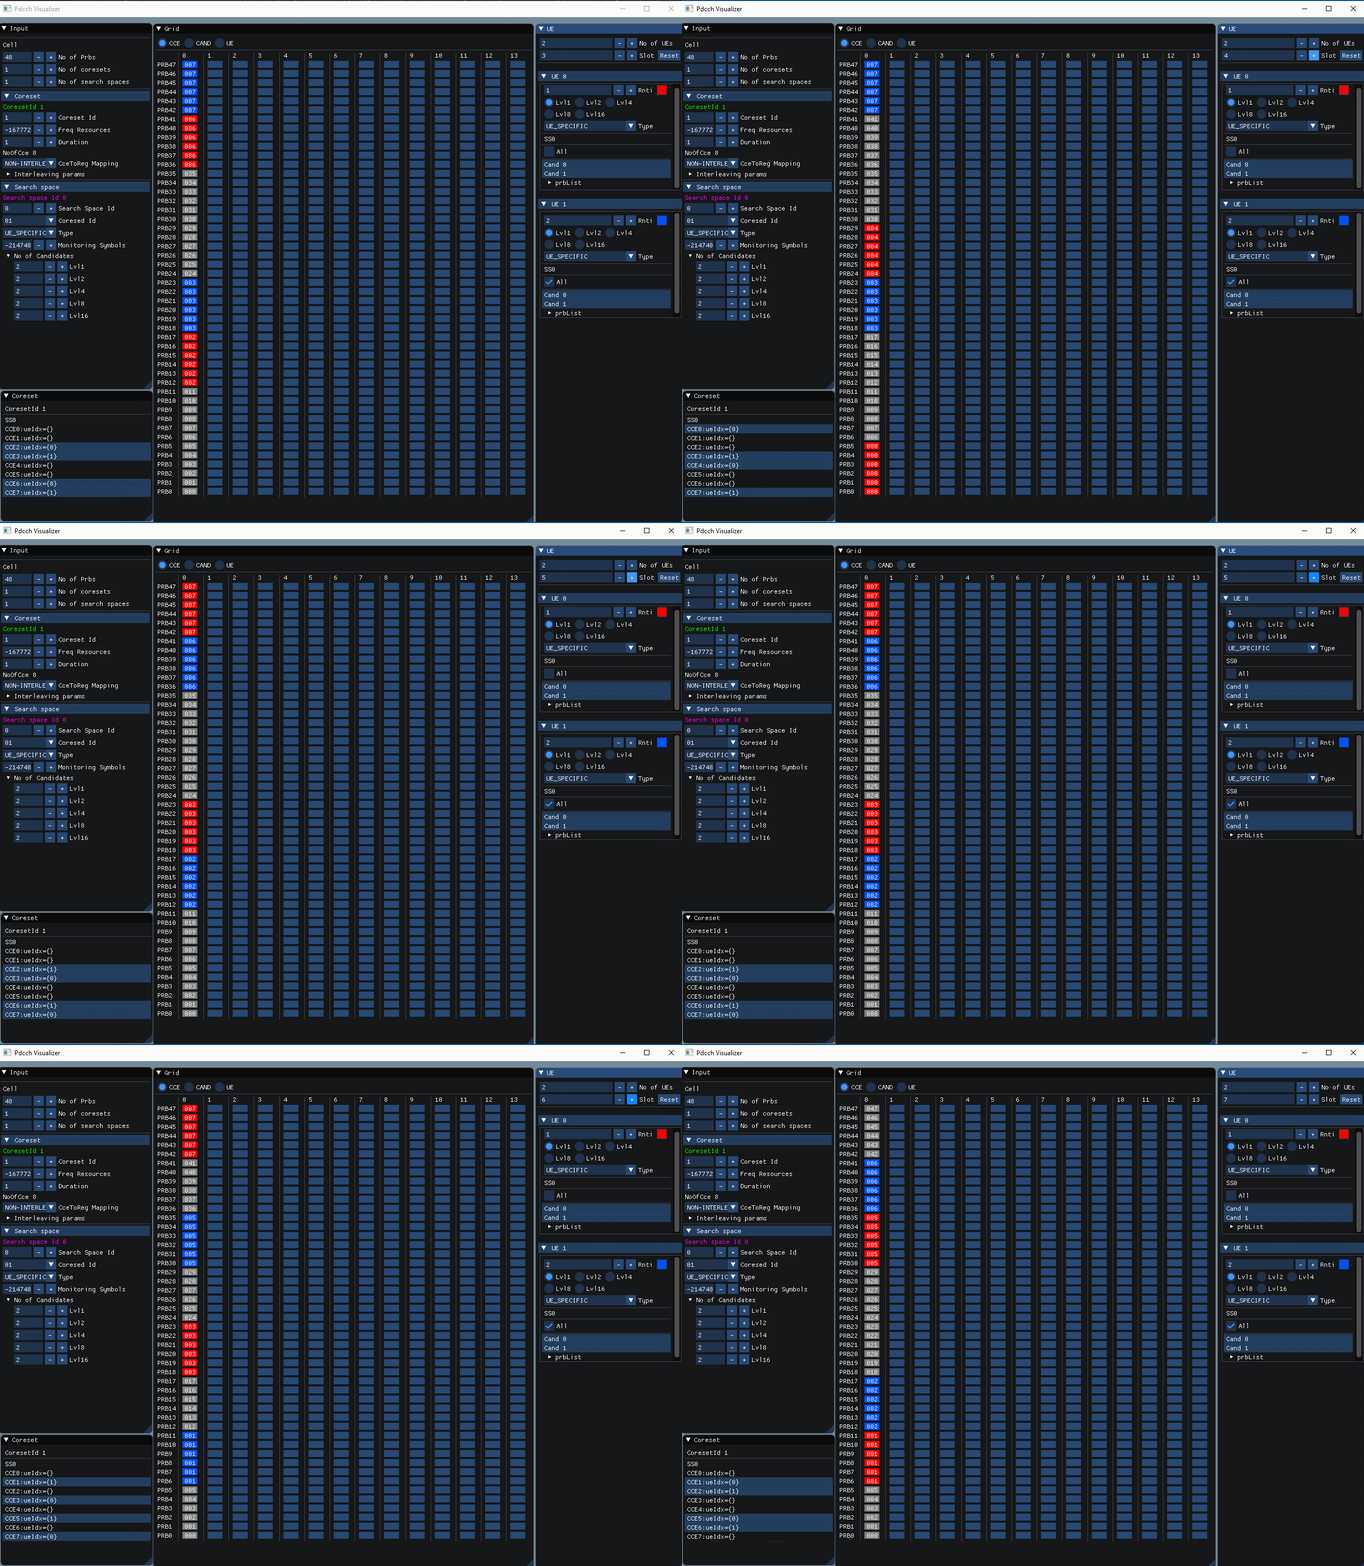
To add UEs, increase “No of UEs” in the UE window.
Notice below that when expanding the UE1 tab, I select “Cand 0” for this new UE in order to see where it’s located in the time-frequency grid.

By changing the slot, one can see how the location of the PDCCH candidates varies over time.
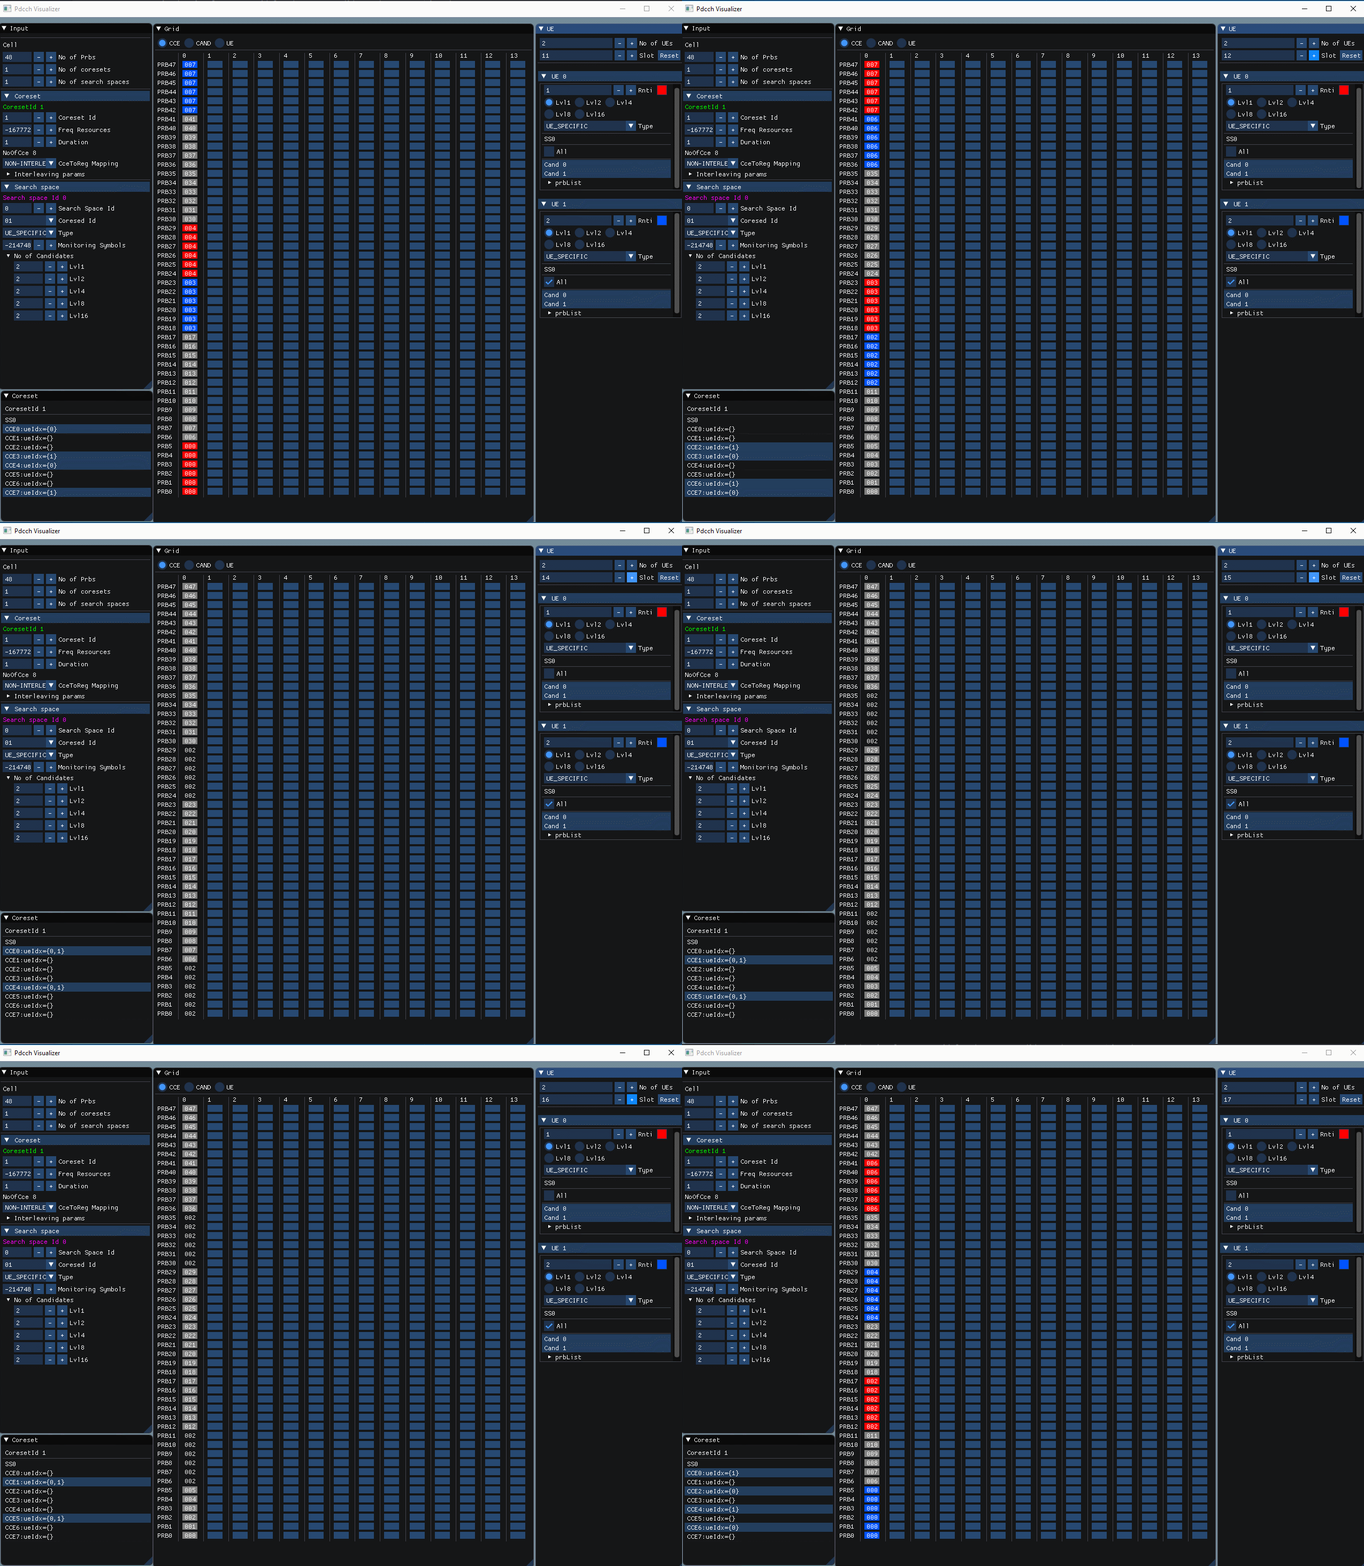
Eventually, when more than one UE is selected, the PDCCH candidates for each might overlap. When this happens, the color of the REG turns black.
The “Coreset” window in the bottom-left shows the UEs whose PDCCH candidate uses a specific CCE index. This can be useful to see how many UEs are using each CCE index.
Notice that in the time of overlap, for some CCE indexes the ueIdx = {0,1}. This means that the UEs with indexes 0 and 1 have PDCCH candidates on the same CCE.
PDCCH Interleaving
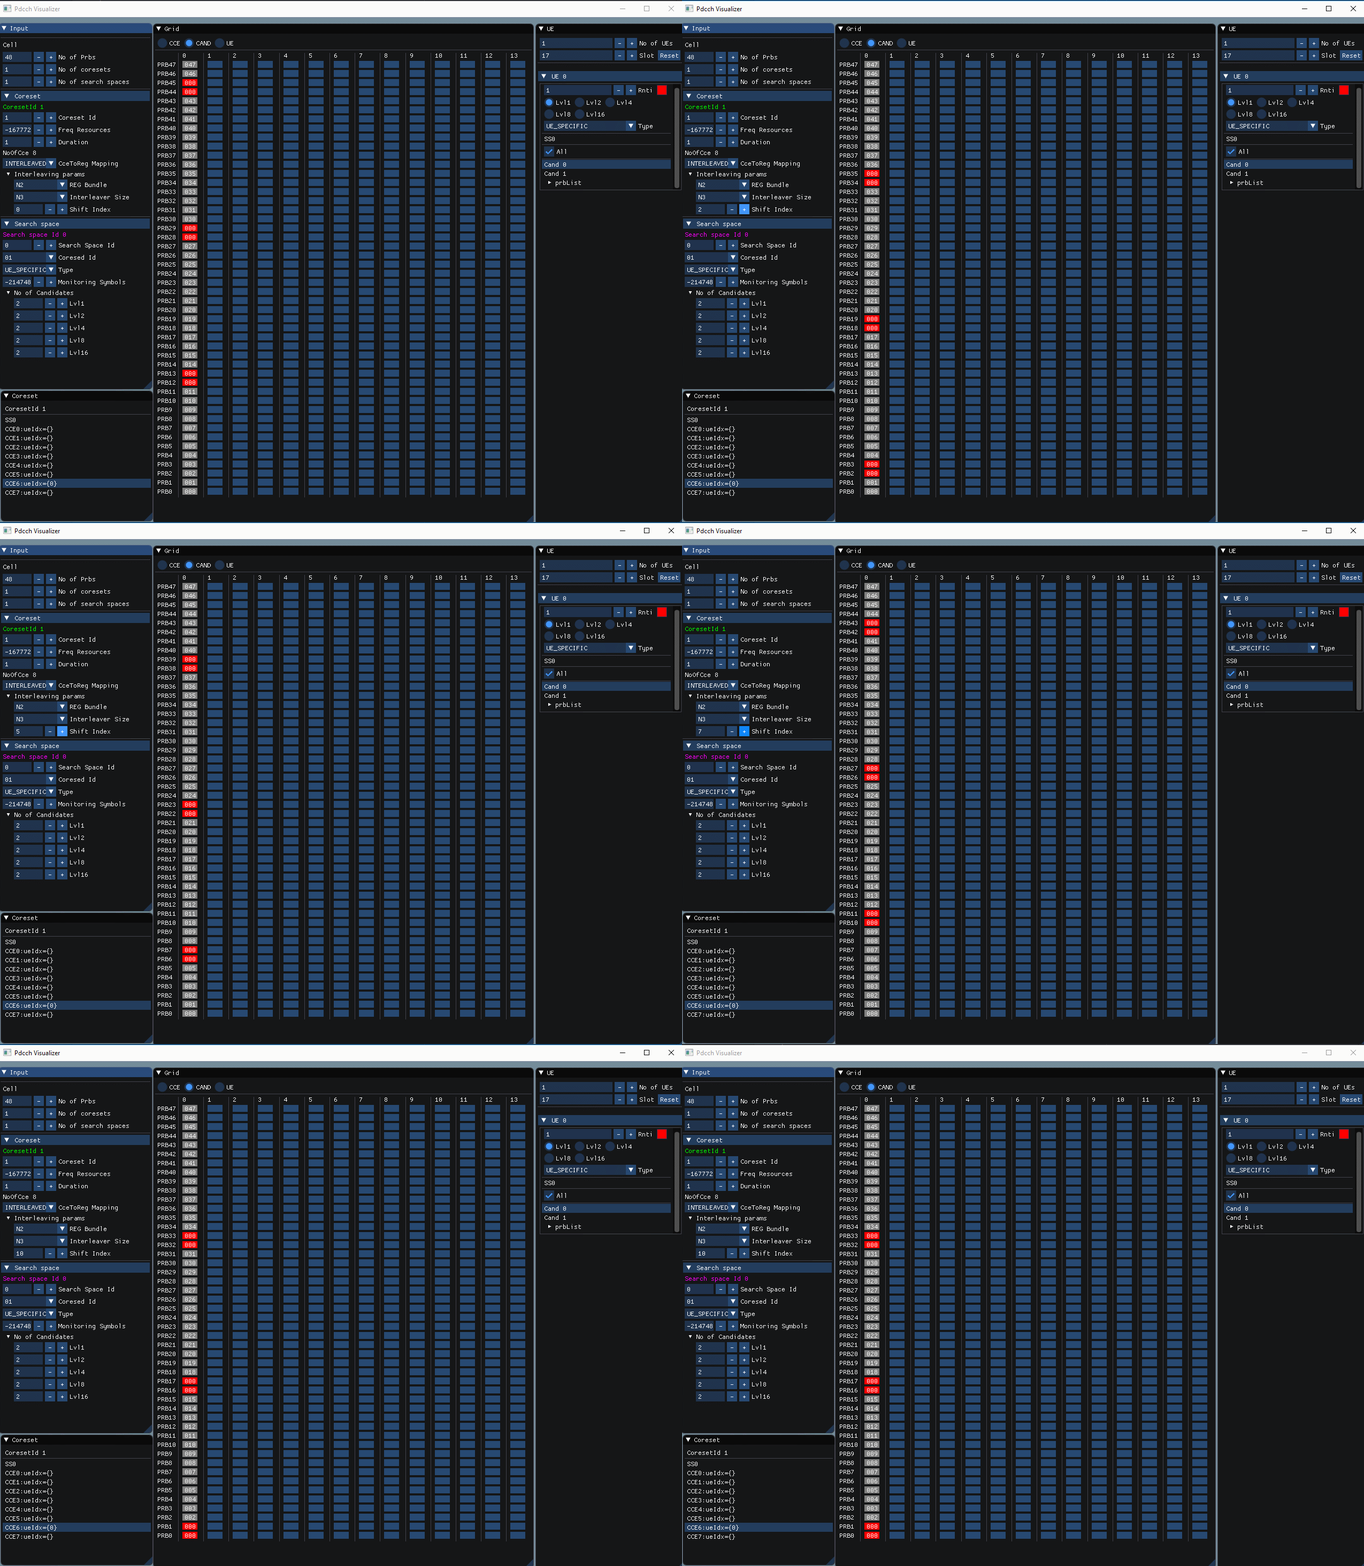
CCE to REG interleaving can be visualized by enabling it the Coreset configuration (“Input” window). We can see how the different interleaving parameters change CCE positions in the time-frequency grid.
Below you can see how interleaving is enabled.
Notice that a drop-down can be clicked to change interleaving parameters as desired (if the interleaving parameters results in an invalid configuration, an error message will be displayed and interleaving is not applied).
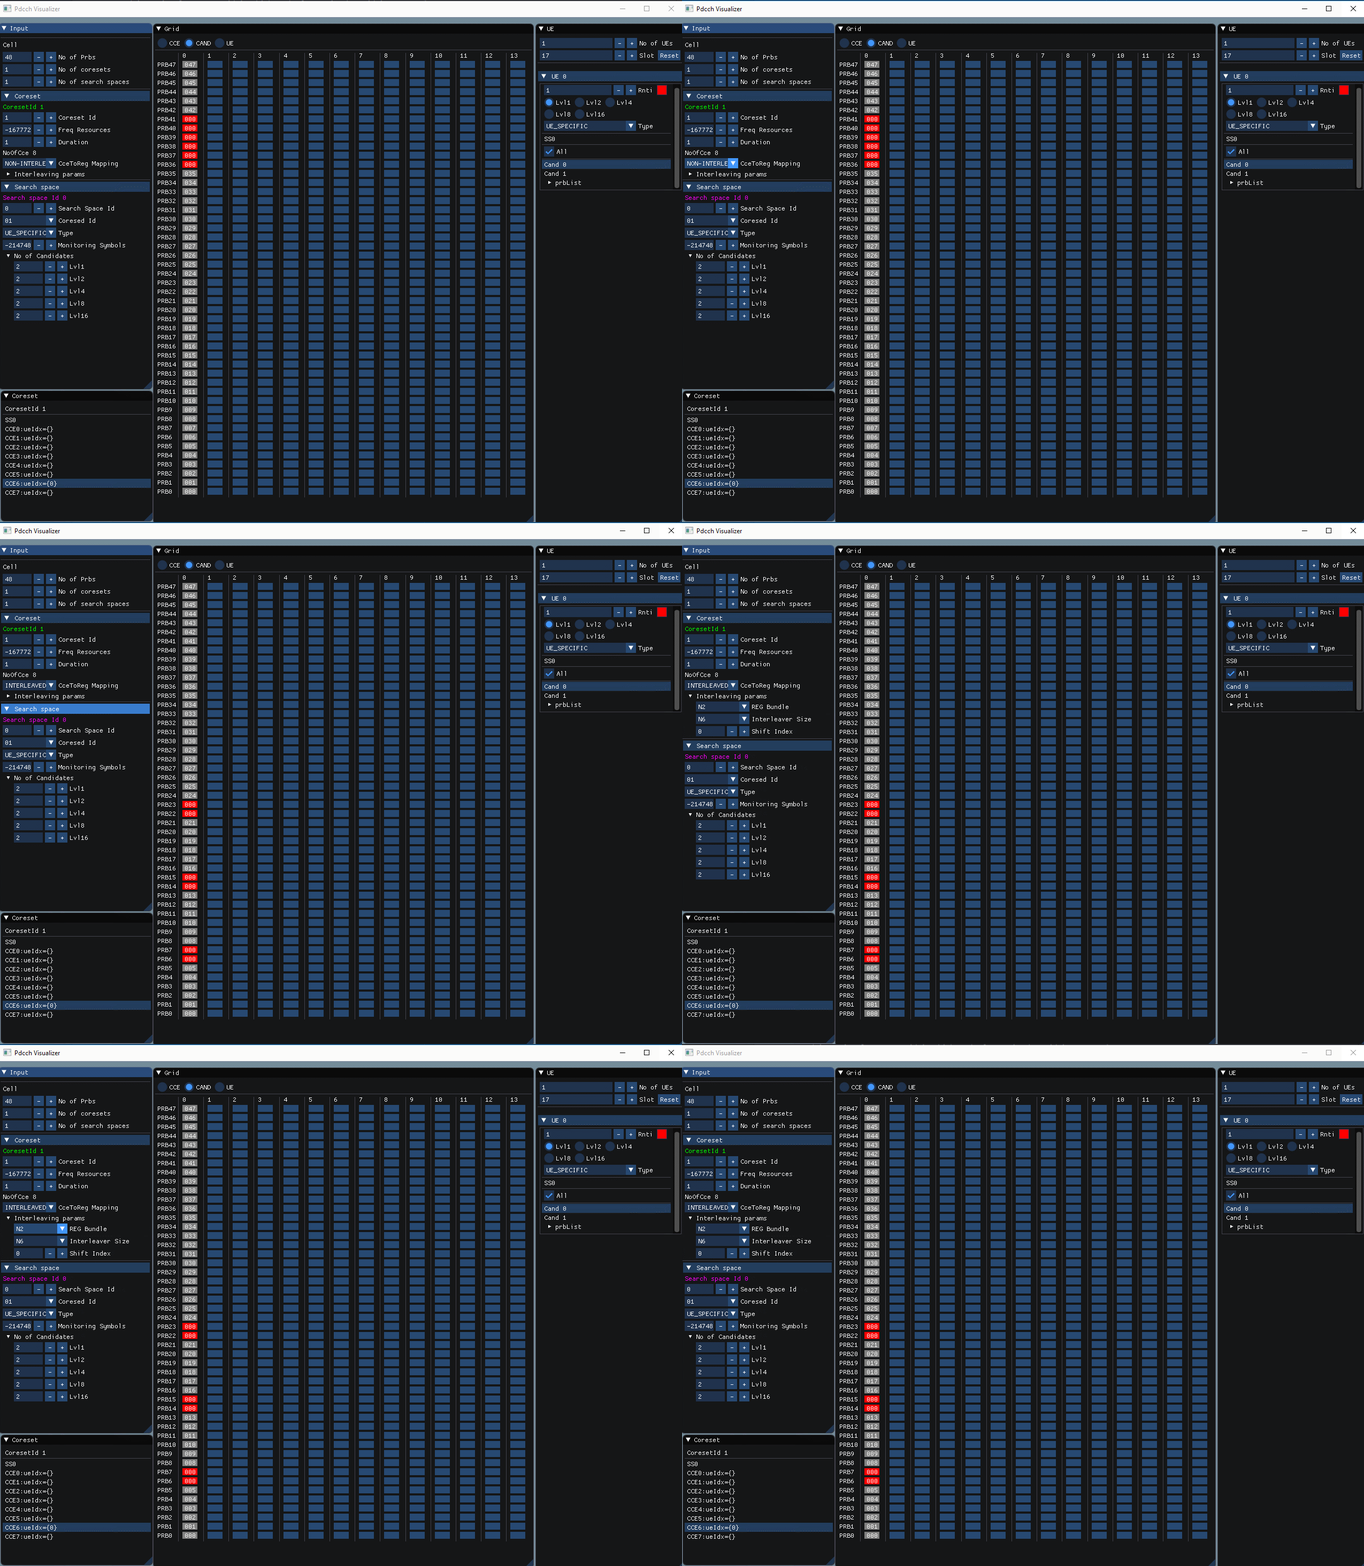
In here, it is easy to see what effect is produced when changing the shift index.
Future work
When I get some time I would like to add some new features and improvements in the tool.
- Save and load configuration from disk
- Improve input method for monitoringSymbols and freqResources
- Support for monitoring slot periodicty and offset
- Auto-play slot time controls